[Pt 1] Installing and Configuring the Kubernetes Dashboard with Kind

This process has been well documented by the various Kubernetes teams. My overview is basically replicant with details that I deem valuable. Under no circumstances is this a definitive guide
Kind is Kubernetes in Docker and it’s a great alternative to using a cloud provider for a quick and dirty kubernetes instance. There are, of course, some shortcomings with using kind but they’re not going to impede us in our quest to install and configure the kubernetes dahsboard.
Kubernetes Dashboard is a Web User Interface for a Kubernetes cluster. It has long been controversial because of its proneness to vulnerabilities.
In this blog, we’re going to install, lock down, and configure the Kubernetes.
Getting Started
Let’s start by creating a kind cluster. If you don’t have kind installed, you can install it with brew:
brew install kind
Next let’s start up a new cluster
kind create cluster
And then we’ll point our kubeconfig at the newly created cluster
export KUBECONFIG="$(kind get kubeconfig-path --name="kind")"
Great, now we have a kind cluster and we’re ready to get installing
Installation
To deploy the Kubernetes dashboard (not enabled by default), we’ll apply yaml from the Kubernetes project itself
kubectl apply -f https://raw.githubusercontent.com/kubernetes/dashboard/v2.0.0-beta8/aio/deploy/recommended.yaml
This yaml can be found at the URL listed above. Let’s quickly breakdown what’s being installed:
Create a new Namespace called kubernetes-dashboard
apiVersion: v1
kind: Namespace
metadata:
  name: kubernetes-dashboard
Create a Service Account in the newly create kubernetes-dashboard namespace called kubernetes-dashboard
apiVersion: v1
kind: ServiceAccount
metadata:
  labels:
    k8s-app: kubernetes-dashboard
  name: kubernetes-dashboard
  namespace: kubernetes-dashboard
Create a new Service for the dashboard using a clusterIP type (IP only available within the cluster)
kind: Service
apiVersion: v1
metadata:
  labels:
    k8s-app: kubernetes-dashboard
  name: kubernetes-dashboard
  namespace: kubernetes-dashboard
spec:
  ports:
    - port: 443
      targetPort: 8443
  selector:
    k8s-app: kubernetes-dashboard
Next we create three Secrets and a ConfigMap. Our secretes are listed as opaque meaning they can be arbitrary sets of key value pairs. The secrets define kubernetes-dashboard-certs, kubernetes-dashboard-csrf, and kubernetes-dashboard-key-holder respectively. The ConfigMap simply defines an empty map of kubernetes-dashboard-settings. We’ll explore what these are later in the configuration section.
---

apiVersion: v1
kind: Secret
metadata:
  labels:
    k8s-app: kubernetes-dashboard
  name: kubernetes-dashboard-certs
  namespace: kubernetes-dashboard
type: Opaque

---

apiVersion: v1
kind: Secret
metadata:
  labels:
    k8s-app: kubernetes-dashboard
  name: kubernetes-dashboard-csrf
  namespace: kubernetes-dashboard
type: Opaque
data:
  csrf: ""

---

apiVersion: v1
kind: Secret
metadata:
  labels:
    k8s-app: kubernetes-dashboard
  name: kubernetes-dashboard-key-holder
  namespace: kubernetes-dashboard
type: Opaque

---

kind: ConfigMap
apiVersion: v1
metadata:
  labels:
    k8s-app: kubernetes-dashboard
  name: kubernetes-dashboard-settings
  namespace: kubernetes-dashboard
Create a Role for in cluster RBAC best practices
kind: Role
apiVersion: rbac.authorization.k8s.io/v1
metadata:
  labels:
    k8s-app: kubernetes-dashboard
  name: kubernetes-dashboard
  namespace: kubernetes-dashboard
rules:
  # Allow Dashboard to get, update and delete Dashboard exclusive secrets.
  - apiGroups: [""]
    resources: ["secrets"]
    resourceNames: ["kubernetes-dashboard-key-holder", "kubernetes-dashboard-certs", "kubernetes-dashboard-csrf"]
    verbs: ["get", "update", "delete"]
    # Allow Dashboard to get and update 'kubernetes-dashboard-settings' config map.
  - apiGroups: [""]
    resources: ["configmaps"]
    resourceNames: ["kubernetes-dashboard-settings"]
    verbs: ["get", "update"]
    # Allow Dashboard to get metrics.
  - apiGroups: [""]
    resources: ["services"]
    resourceNames: ["heapster", "dashboard-metrics-scraper"]
    verbs: ["proxy"]
  - apiGroups: [""]
    resources: ["services/proxy"]
    resourceNames: ["heapster", "http:heapster:", "https:heapster:", "dashboard-metrics-scraper", "http:dashboard-metrics-scraper"]
    verbs: ["get"]
Create a ClusterRole which gives the dashboard access to all namespaces
kind: ClusterRole
apiVersion: rbac.authorization.k8s.io/v1
metadata:
  labels:
    k8s-app: kubernetes-dashboard
  name: kubernetes-dashboard
rules:
  # Allow Metrics Scraper to get metrics from the Metrics server
  - apiGroups: ["metrics.k8s.io"]
    resources: ["pods", "nodes"]
    verbs: ["get", "list", "watch"]
Next, create the RoleBinding for our Service Account and ClusterRole
---

apiVersion: rbac.authorization.k8s.io/v1
kind: RoleBinding
metadata:
  labels:
    k8s-app: kubernetes-dashboard
  name: kubernetes-dashboard
  namespace: kubernetes-dashboard
roleRef:
  apiGroup: rbac.authorization.k8s.io
  kind: Role
  name: kubernetes-dashboard
subjects:
  - kind: ServiceAccount
    name: kubernetes-dashboard
    namespace: kubernetes-dashboard

---

apiVersion: rbac.authorization.k8s.io/v1
kind: ClusterRoleBinding
metadata:
  name: kubernetes-dashboard
roleRef:
  apiGroup: rbac.authorization.k8s.io
  kind: ClusterRole
  name: kubernetes-dashboard
subjects:
  - kind: ServiceAccount
    name: kubernetes-dashboard
    namespace: kubernetes-dashboard
Finally, we arrive at the dashabord Deployment. This is the piece that actually deploys our dashboard.
kind: Deployment
apiVersion: apps/v1
metadata:
  labels:
    k8s-app: kubernetes-dashboard
  name: kubernetes-dashboard
  namespace: kubernetes-dashboard
spec:
  replicas: 1
  revisionHistoryLimit: 10
  selector:
    matchLabels:
      k8s-app: kubernetes-dashboard
  template:
    metadata:
      labels:
        k8s-app: kubernetes-dashboard
    spec:
      containers:
        - name: kubernetes-dashboard
          image: kubernetesui/dashboard:v2.0.0-beta8
          imagePullPolicy: Always
          ports:
            - containerPort: 8443
              protocol: TCP
          args:
            - --auto-generate-certificates
            - --namespace=kubernetes-dashboard
            # Uncomment the following line to manually specify Kubernetes API server Host
            # If not specified, Dashboard will attempt to auto discover the API server and connect
            # to it. Uncomment only if the default does not work.
            # - --apiserver-host=http://my-address:port
          volumeMounts:
            - name: kubernetes-dashboard-certs
              mountPath: /certs
              # Create on-disk volume to store exec logs
            - mountPath: /tmp
              name: tmp-volume
          livenessProbe:
            httpGet:
              scheme: HTTPS
              path: /
              port: 8443
            initialDelaySeconds: 30
            timeoutSeconds: 30
          securityContext:
            allowPrivilegeEscalation: false
            readOnlyRootFilesystem: true
            runAsUser: 1001
            runAsGroup: 2001
      volumes:
        - name: kubernetes-dashboard-certs
          secret:
            secretName: kubernetes-dashboard-certs
        - name: tmp-volume
          emptyDir: {}
      serviceAccountName: kubernetes-dashboard
      nodeSelector:
        "beta.kubernetes.io/os": linux
      # Comment the following tolerations if Dashboard must not be deployed on master
      tolerations:
        - key: node-role.kubernetes.io/master
          effect: NoSchedule
The Installation doesn’t leave us shorthanded. As its last two items, it provides a metrics scrapper and metrics dashboard for monitoring the cluster and dashboard.
kind: Service
apiVersion: v1
metadata:
  labels:
    k8s-app: dashboard-metrics-scraper
  name: dashboard-metrics-scraper
  namespace: kubernetes-dashboard
spec:
  ports:
    - port: 8000
      targetPort: 8000
  selector:
    k8s-app: dashboard-metrics-scraper

---

kind: Deployment
apiVersion: apps/v1
metadata:
  labels:
    k8s-app: dashboard-metrics-scraper
  name: dashboard-metrics-scraper
  namespace: kubernetes-dashboard
spec:
  replicas: 1
  revisionHistoryLimit: 10
  selector:
    matchLabels:
      k8s-app: dashboard-metrics-scraper
  template:
    metadata:
      labels:
        k8s-app: dashboard-metrics-scraper
      annotations:
        seccomp.security.alpha.kubernetes.io/pod: 'runtime/default'
    spec:
      containers:
        - name: dashboard-metrics-scraper
          image: kubernetesui/metrics-scraper:v1.0.1
          ports:
            - containerPort: 8000
              protocol: TCP
          livenessProbe:
            httpGet:
              scheme: HTTP
              path: /
              port: 8000
            initialDelaySeconds: 30
            timeoutSeconds: 30
          volumeMounts:
          - mountPath: /tmp
            name: tmp-volume
          securityContext:
            allowPrivilegeEscalation: false
            readOnlyRootFilesystem: true
            runAsUser: 1001
            runAsGroup: 2001
      serviceAccountName: kubernetes-dashboard
      nodeSelector:
        "beta.kubernetes.io/os": linux
      # Comment the following tolerations if Dashboard must not be deployed on master
      tolerations:
        - key: node-role.kubernetes.io/master
          effect: NoSchedule
      volumes:
        - name: tmp-volume
          emptyDir: {}
After applying these manifests, you should see the following outputted in the CLI
$→ kubectl apply -f https://raw.githubusercontent.com/kubernetes/dashboard/v2.0.0-beta8/aio/deploy/recommended.yaml
namespace/kubernetes-dashboard created
serviceaccount/kubernetes-dashboard created
service/kubernetes-dashboard created
secret/kubernetes-dashboard-certs created
secret/kubernetes-dashboard-csrf created
secret/kubernetes-dashboard-key-holder created
configmap/kubernetes-dashboard-settings created
role.rbac.authorization.k8s.io/kubernetes-dashboard created
clusterrole.rbac.authorization.k8s.io/kubernetes-dashboard created
rolebinding.rbac.authorization.k8s.io/kubernetes-dashboard created
clusterrolebinding.rbac.authorization.k8s.io/kubernetes-dashboard created
deployment.apps/kubernetes-dashboard created
service/dashboard-metrics-scraper created
deployment.apps/dashboard-metrics-scraper created
We can attach to the dashboard by creating a proxy into the cluster. Kubectl handles all the plumbing, and gives us a nice window on our own localhost into the cluster.
kubectl proxy
The dashboard will be available after the proxy is created at: http://localhost:8001/api/v1/namespaces/kubernetes-dashboard/services/https:kubernetes-dashboard:/proxy/
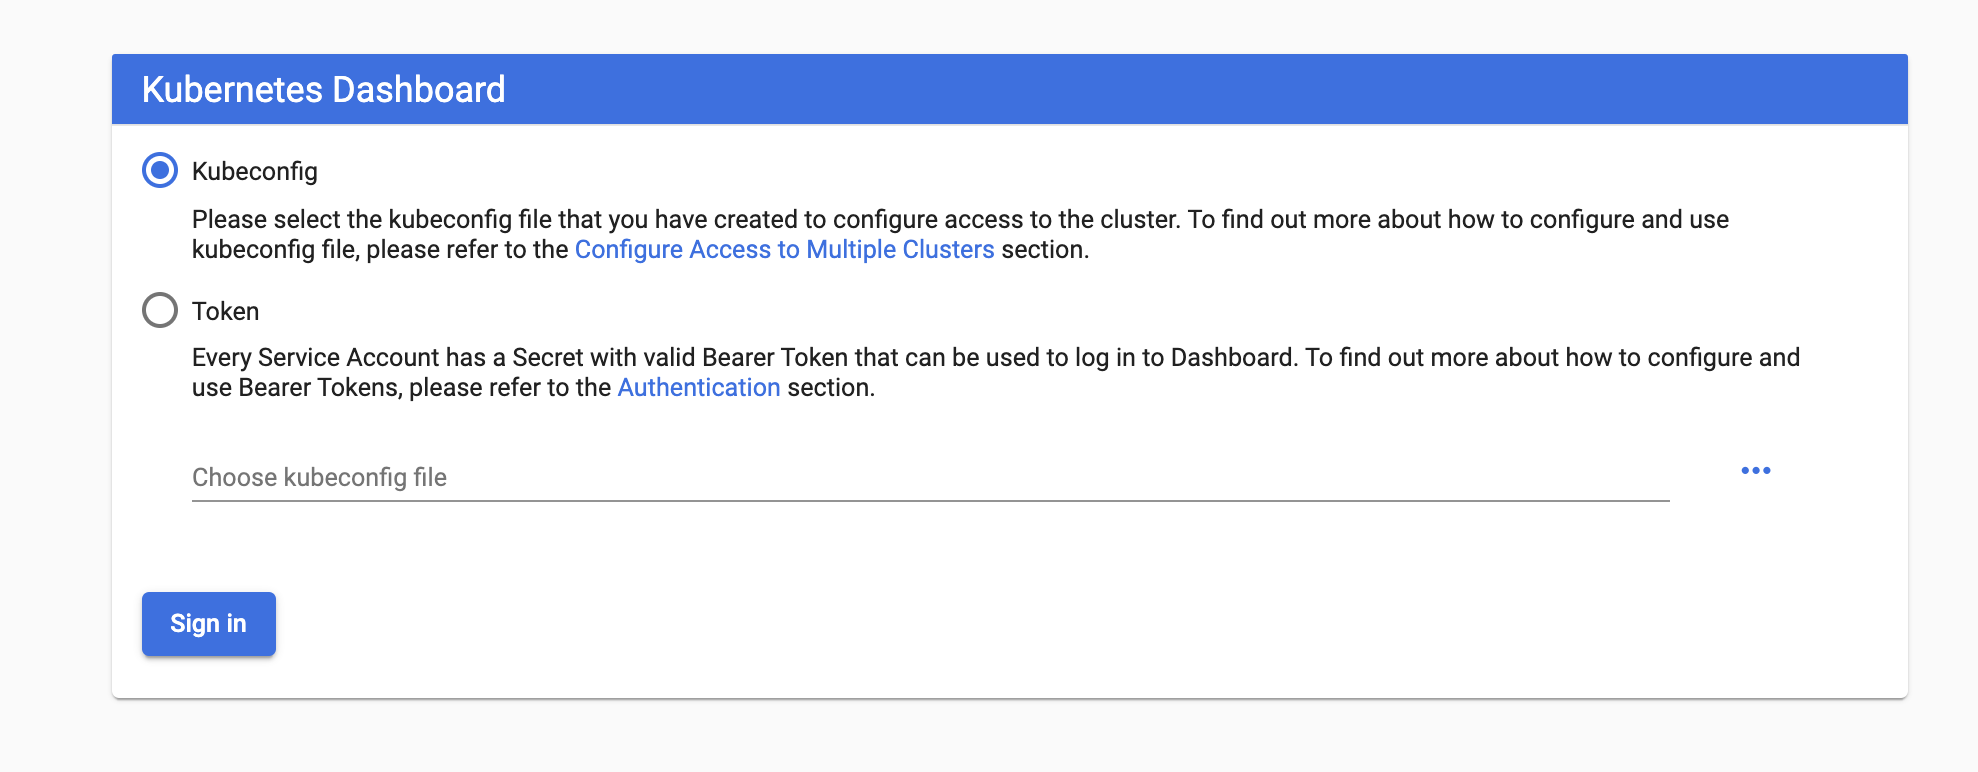
Let’s get started with the Service Accounts Bearer Token
kubectl -n kube-system describe secret $(
  kubectl -n kube-system get secret | \
  awk '/^deployment-controller-token-/{print $1}'
) | \
awk '$1=="token:"{print $2}'
Installing an App
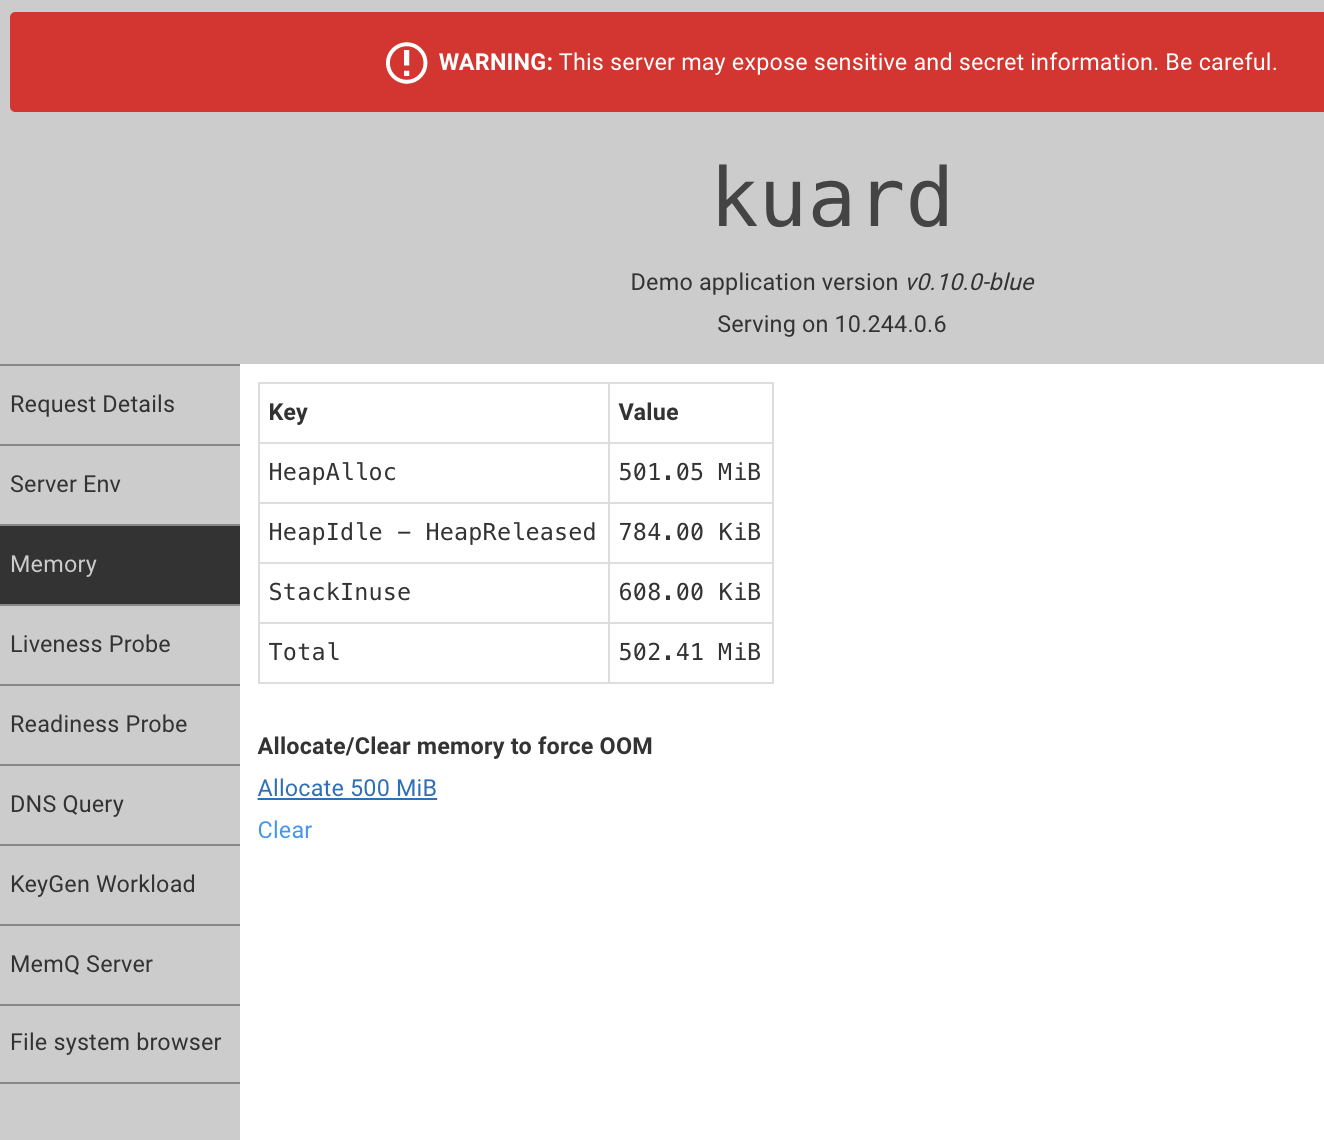
Let’s get started by deploying an application on to our cluster so we can see things move around on the dashboard. A good place to start is with kuard.
kubectl run --restart=Never --image=gcr.io/kuar-demo/kuard-amd64:blue kuard
kubectl port-forward kuard 8080:8080
Now let’s switch back to the dashboard
http://localhost:8001/api/v1/namespaces/kubernetes-dashboard/services/https:kubernetes-dashboard:/proxy/
We can see the pod that’s been spun up for kaurd
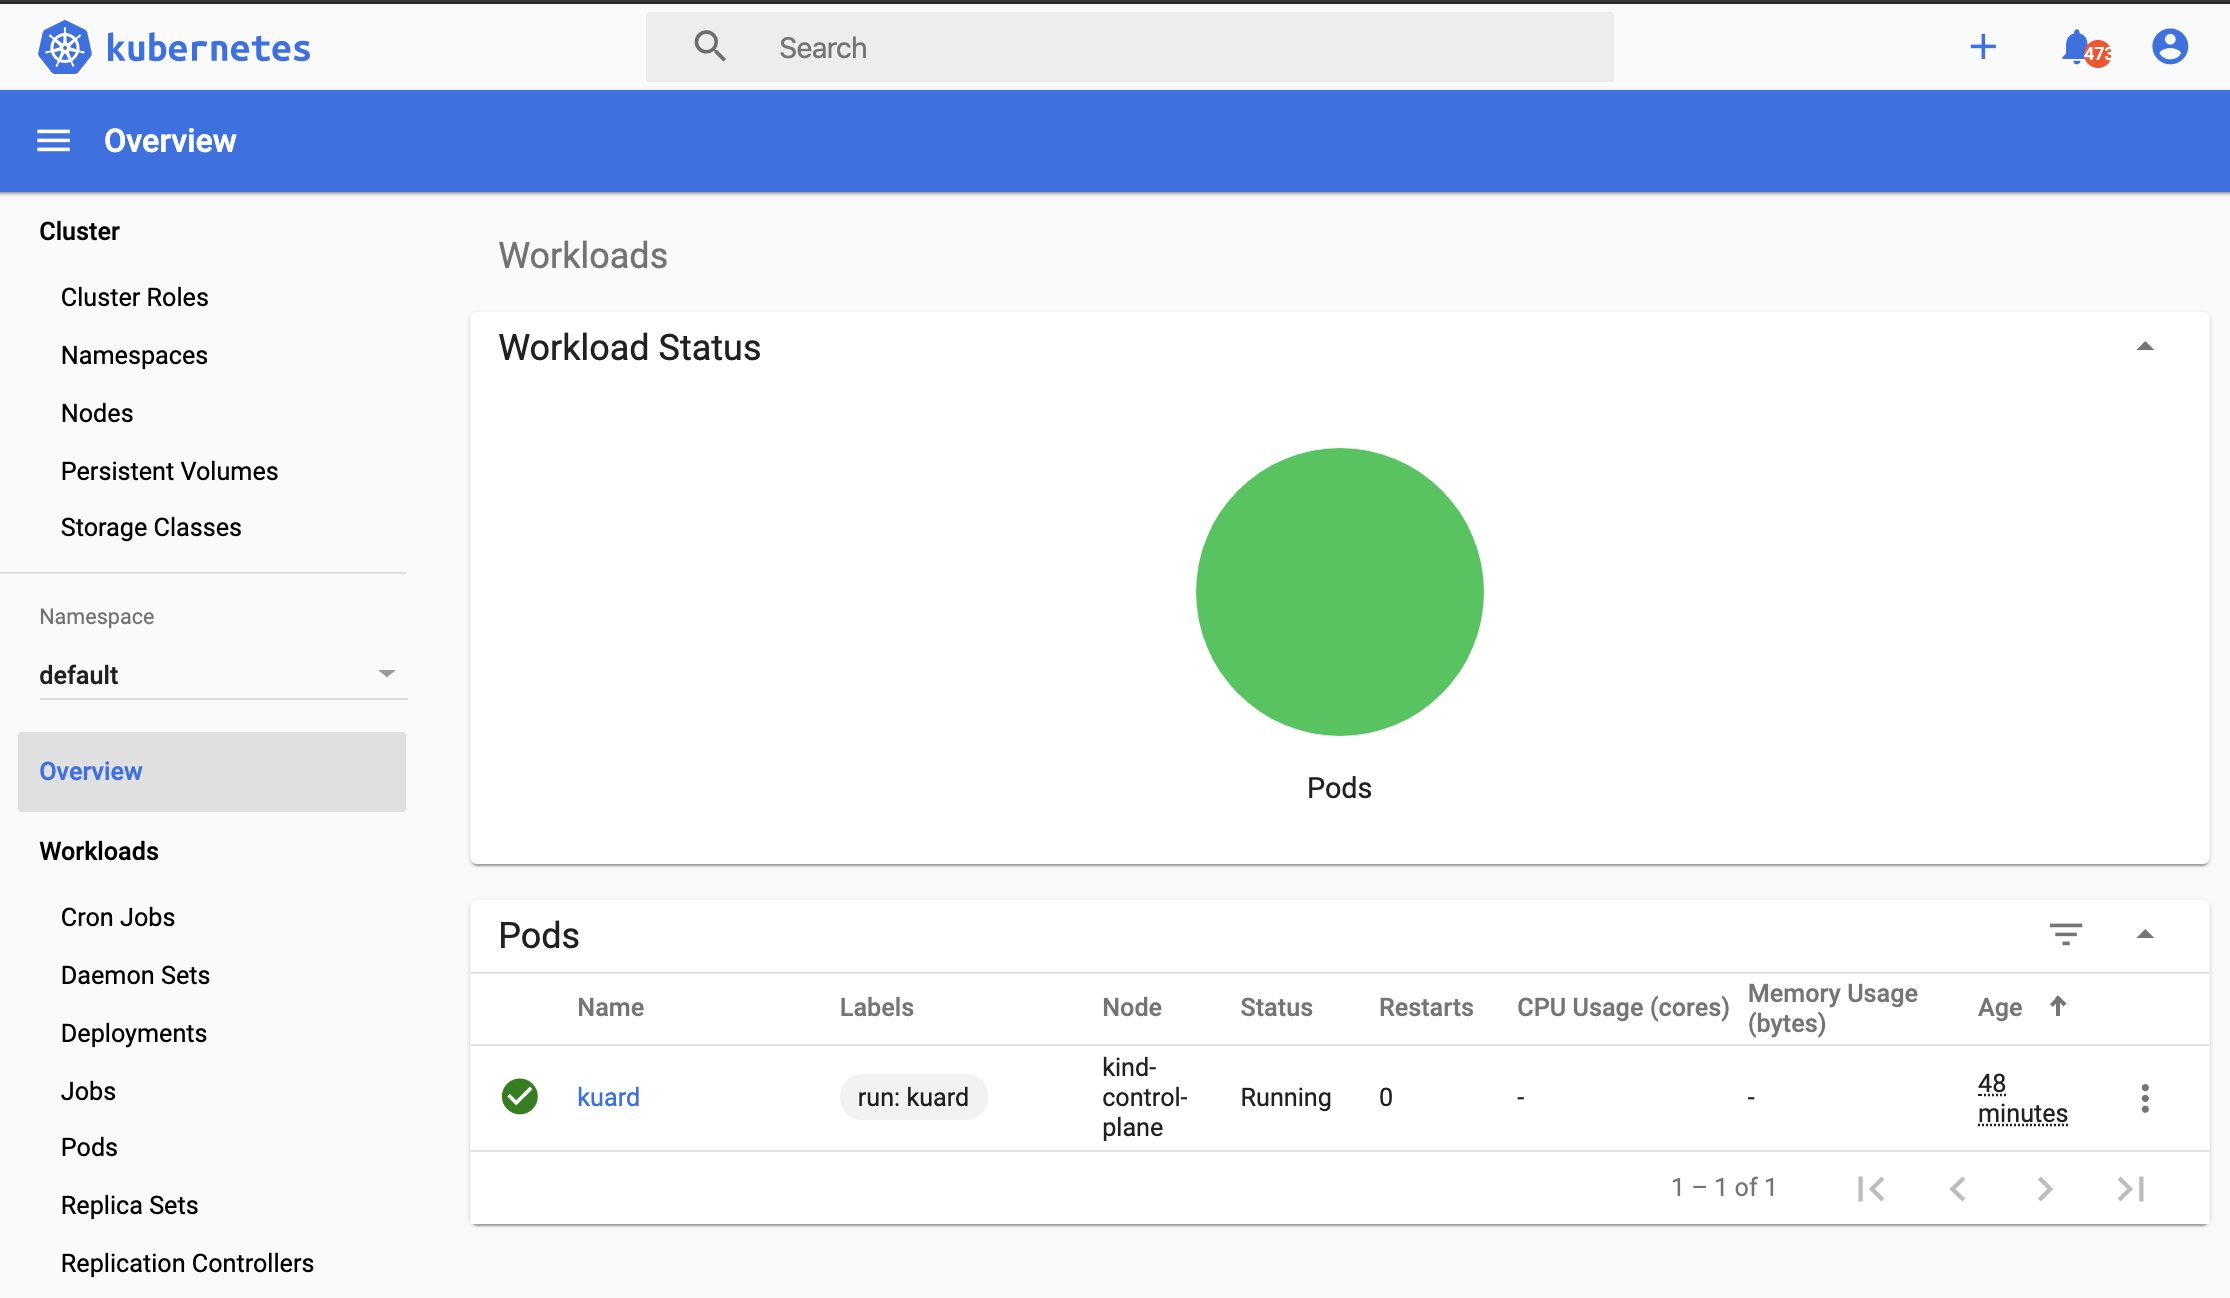
From here we can mess with Kuard’s features to simulate different use cases within the cluster
Conclusion
We’ll follow up in Part 2 configuring the dashboard.